Supply Chain Analytics Challenges and How to Overcome Them

June 29, 2026 | By Jabil Procurement & Supply Chain Team
Supply chain analytics challenges often begin when companies have more data than they can trust, connect, or act on. Analytics can improve forecasting, supplier performance, inventory planning, logistics visibility, and procurement decisions, but those benefits depend on accurate data, integrated systems, and clear ownership of the actions that follow.
That is why supply chain analytics has become more than a reporting function. For many organizations, it is now a core decision-making capability. Leaders need to understand what is happening across the supply chain, why performance is changing, where risk may emerge, and which actions can improve cost, service, resilience, and speed.
The challenge is that many analytics programs stall before they reach that level of impact. Data may sit across disconnected systems, forecasts may rely too heavily on historical patterns, and dashboards may highlight issues without making the next step clear. To create real value, organizations need a stronger connection between the data they collect, the decisions they make, and the actions teams take across the supply chain.
Key Points
- Analytics Needs Trustworthy Data: Supply chain analytics depends on accurate, complete, and consistently governed data across suppliers, inventory, logistics, planning, and operations.
- Silos Limit Decision-Making: When procurement, logistics, finance, suppliers, and operations work from disconnected systems, teams may optimize locally while creating costs elsewhere.
- Forecasts Need Real-Time Context: Historical data is useful, but forecasting improves when teams add current supplier, inventory, logistics, demand, and market signals.
- Adoption Depends on Workflows: Analytics tools only create value when teams trust the data, understand the use case, and can apply insights inside daily decisions.
- Action Ownership Matters: Dashboards are not enough; organizations need clear owners for alerts, follow-up actions, escalations, and measurable outcomes.
What Is Supply Chain Analytics?
Supply chain analytics is the process of collecting, connecting, and analyzing data from across the supply chain to improve decisions about procurement, planning, inventory, logistics, suppliers, and operations. It helps organizations move from fragmented information to a clearer view of performance, risk, and opportunity.
At a basic level, supply chain analytics helps teams answer four questions: What happened? Why did it happen? What is likely to happen next? And what should we do about it?
That progression matters because supply chain leaders are rarely making isolated decisions. A supplier delay can affect inventory availability. Inventory gaps can affect production schedules. Transportation constraints can affect customer service. Analytics helps connect those signals so teams can make faster, more informed decisions across the network.
The Four Types of Supply Chain Analytics
- Descriptive analytics: Tracks historical supply chain performance such as inventory levels, order delays, fulfillment rates, and delivery metrics.
- Diagnostic analytics: Identifies the root causes behind supply chain issues such as supplier delays, rising transportation costs, or operational bottlenecks.
- Predictive analytics: Uses historical and real-time data to forecast demand, estimate lead times, predict shortages, and anticipate disruptions.
- Prescriptive analytics: Recommends actions to improve outcomes, including inventory adjustments, sourcing changes, and transportation optimization.
The goal is not simply to create more reports. The value of supply chain analytics comes from helping teams understand conditions, compare options, and act with greater confidence.
What Are the Biggest Supply Chain Analytics Challenges?
The biggest supply chain analytics challenges include poor data quality, disconnected systems, data silos, limited visibility, inaccurate forecasting, weak adoption, and difficulty turning insights into action.
These issues often compound because supply chain decisions are interconnected. When one part of the data foundation is unreliable, the impact can spread across procurement, inventory, logistics, supplier management, and operations.
| Challenge | Common Causes | Business Impact |
|---|---|---|
| Poor Data Quality | Manual data entry, inconsistent formats, outdated records | Creates inaccurate forecasts, reports, and decisions |
| Data Silos | Separate systems across departments, limited data sharing | Prevents teams from seeing how procurement, logistics, inventory, and demand interact |
| Limited Visibility | Lack of real-time tracking and fragmented supplier data | Makes it harder to identify disruptions before they affect operations |
| Weak Integration | Legacy systems, incompatible software, poor API connectivity | Slows data flow between ERP, WMS, TMS, procurement, planning, and supplier systems |
| Forecasting Volatility | Rapid market shifts, seasonal demand swings, unreliable historical data | Reduces planning accuracy when market conditions change |
| Adoption Barriers | Complex tools, insufficient training, resistance to process changes | Prevents teams from using analytics in daily workflows |
| Insight-to-Action Gaps | Lack of automation, unclear ownership, delayed decision-making processes | Leaves teams with dashboards but no clear next step |
Data Quality and Integration Issues
Data quality is important in supply chain analytics because inaccurate, incomplete, or inconsistent data can distort forecasts, delay decisions, and create false confidence in the wrong course of action. When teams cannot trust the information behind a dashboard or model, analytics becomes less useful as a decision-making tool.
That challenge becomes harder when critical information sits across systems that do not easily connect. On Jabil’s End-to-End Insights podcast, Frank McKay, Jabil’s Chief Supply Chain Officer, explained:
“If you have disparate systems, disconnected systems, or data residing in different systems, it makes your ability to make truly informed strategic or intelligent decisions in that end-to-end supply chain that much more difficult.”

Listen to the full End-to-End Insights episode with Frank McKay.
These issues often start with the basics. Supplier lead times may be outdated, part numbers may be duplicated, and inventory, order, shipment, ASN, or demand data may be missing, delayed, or manually updated in spreadsheets. Different regions, sites, or business units may also define the same metric in different ways, making performance difficult to compare.
Integration adds another layer of complexity. Many organizations rely on ERP, WMS, TMS, procurement, planning, and supplier platforms that were not designed to work together seamlessly. When data does not move between those systems quickly or consistently, teams may make decisions using an incomplete view of supply, demand, inventory, or logistics conditions.
How to Improve Supply Chain Data Quality
Companies can improve supply chain data quality by treating data as an operational discipline, not a one-time cleanup project.
- Define shared data standards. Establish consistent definitions for suppliers, parts, inventory, orders, shipments, lead times, and service levels.
- Identify the highest-impact data fields. Focus first on the data that directly affects forecasting, inventory, supplier performance, and customer delivery.
- Assign ownership for data quality. Make it clear who is responsible for maintaining, validating, and updating critical data.
- Clean and standardize master data. Remove duplicates, resolve inconsistent formats, and align naming conventions across systems.
- Integrate systems around priority workflows. Connect data where it supports the most important decisions, such as demand planning, sourcing, transportation, or replenishment.
- Monitor data quality over time. Use recurring checks to identify missing, outdated, or inconsistent information before it affects decisions.
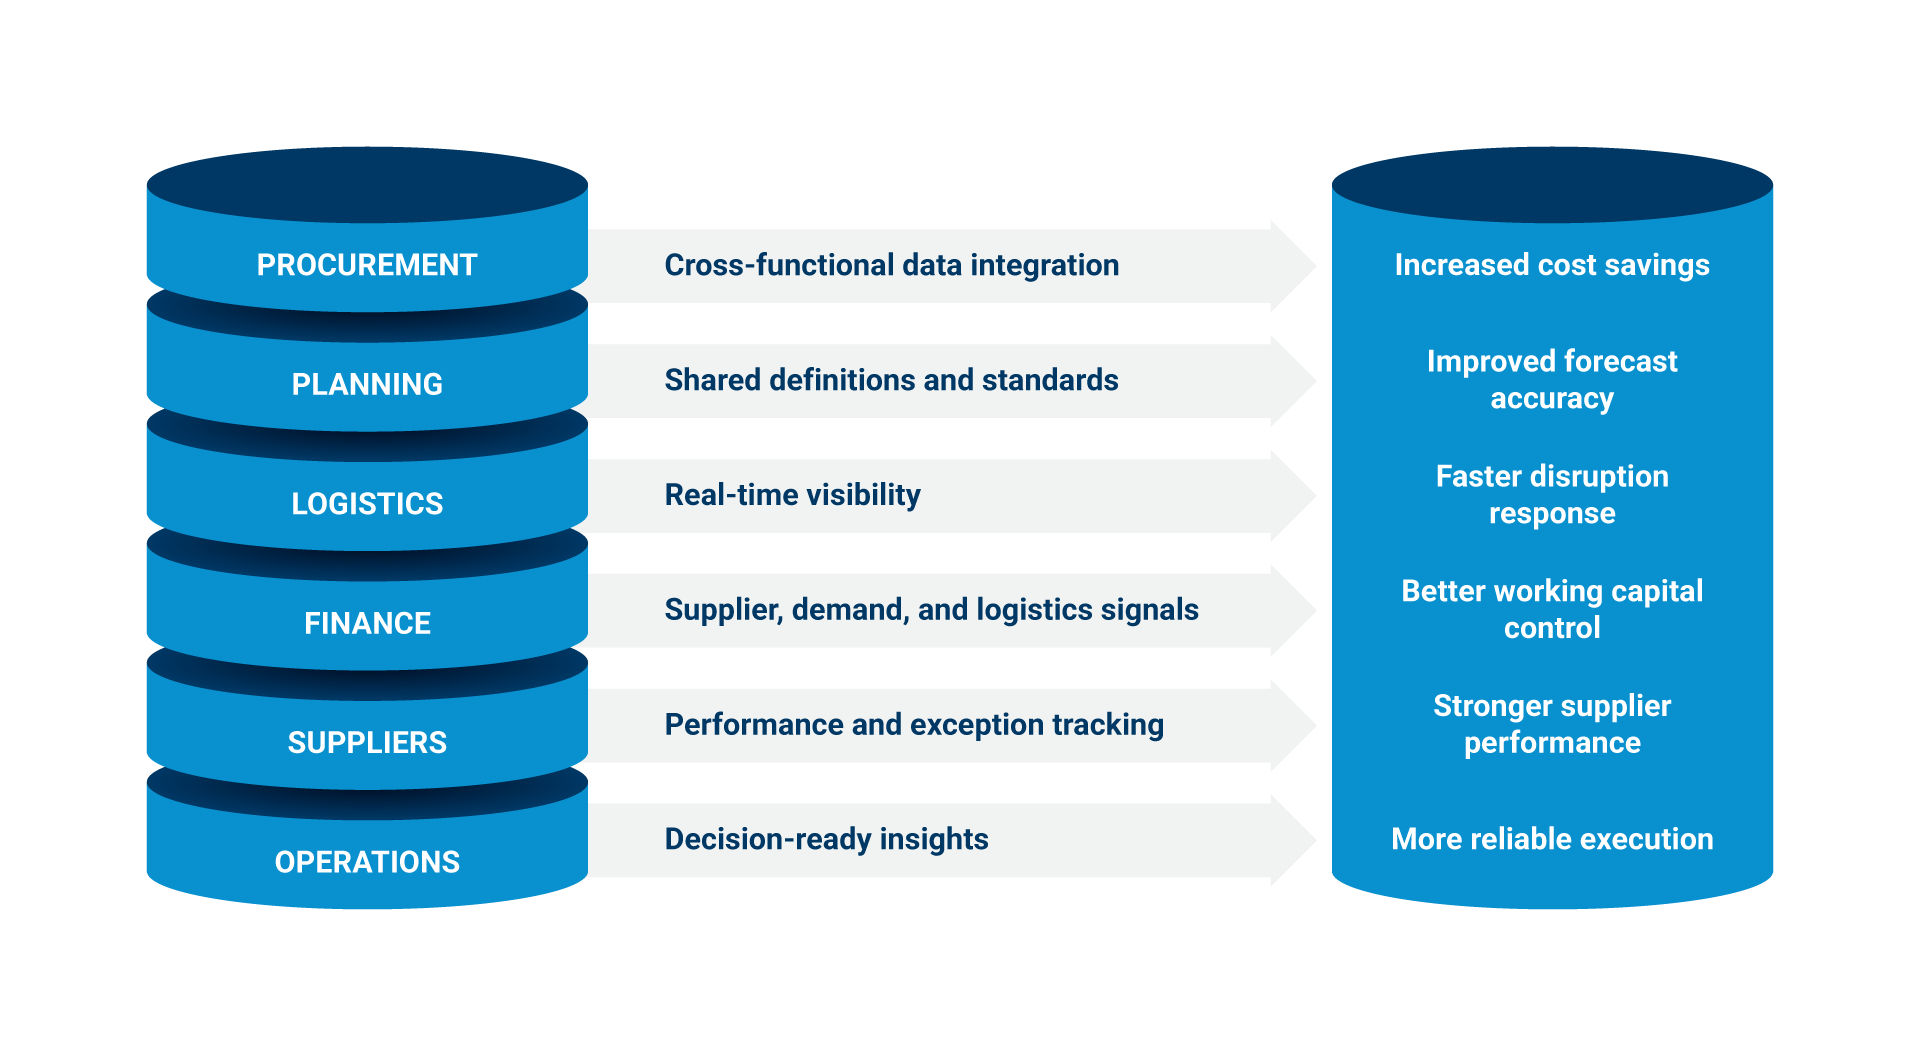
How Data Silos Impact Supply Chain Performance
Data silos reduce supply chain performance because they prevent teams from seeing how decisions in one function affect cost, service, inventory, risk, and execution across the broader network. When procurement, logistics, finance, planning, suppliers, and operations work from separate systems or different definitions, each team may see only part of the picture.
The result is often local optimization. Each function may make a reasonable decision based on its own goals, but that decision can create tradeoffs elsewhere:
- Procurement may prioritize lower unit costs.
- Logistics may focus on transportation efficiency.
- Planning may increase inventory buffers to protect service levels.
- Finance may track working capital exposure.
- Operations may prioritize production continuity.
Breaking Down Supply Chain Data Silos
A procurement team may choose a lower-cost supplier, but if that supplier has longer lead times or inconsistent delivery performance, other teams absorb the impact. Logistics may need to pay more for expedited freight. Planning may raise safety stock. Operations may face more production variability.
The issue is not that one team made the wrong decision. It is that the decision was made with incomplete context.
Supply chain analytics is most valuable when it links supplier data, inventory levels, demand signals, transportation performance, and cost data. With a connected view, organizations can evaluate how decisions affect the broader supply chain and make more balanced choices across cost, speed, service, and resilience.
Limited Visibility and Inaccurate Forecasting
Limited visibility makes forecasting less accurate because supply chain teams cannot model risks, constraints, or demand changes they cannot see. A forecast may appear reliable inside a planning system, but if it does not reflect current supplier performance, in-transit inventory, logistics delays, or changing market conditions, it can quickly fall out of sync with reality. This is one of the most common supply chain analytics challenges because visibility gaps often exist outside a company’s direct operations, including limited insight into tier-n suppliers, in-transit inventory, supplier capacity, or transportation constraints.
When teams have better visibility, they can shift from reacting after a disruption occurs to making earlier, more informed decisions. On Jabil’s End-to-End Insights podcast, Kurt Schaefer explained:
“Anything you can move into a proactive state versus a reactive state is always going to yield a better result.”

Listen to the full End-to-End Insights episode with Kurt Schaefer and Alan Garcia.
Historical data still matters, but it is not enough on its own. Past demand patterns may not account for sudden market shifts, customer behavior changes, port delays, labor disruptions, or supplier shortages. When forecasting relies too heavily on backward-looking data, organizations may react too late or overcorrect with excess inventory, expedited freight, or last-minute sourcing changes.
How to Improve Forecasting Accuracy
Companies can improve supply chain forecasting accuracy by combining historical performance with more current and connected data signals.
- Combine historical data with real-time supply, demand, inventory, and logistics signals.
- Monitor supplier and logistics performance continuously.
- Use predictive analytics to model demand, capacity, shortage, and risk scenarios.
- Build exception alerts for material changes in lead times, inventory levels, or delivery performance.
- Run scenario planning before disruptions escalate.
- Review forecast assumptions regularly as market and operating conditions change.
Better forecasting starts with better visibility. When teams can see more of the supply chain, they can model uncertainty more accurately and make decisions earlier.
Overcoming Analytics Adoption Barriers
Companies can overcome supply chain analytics adoption barriers by starting with specific business decisions, involving end users early, simplifying workflows, and assigning clear ownership for action. Even strong analytics tools can struggle to gain traction if teams do not trust the data, understand the use case, or know how insights should change daily decisions.
Adoption barriers often appear in practical ways. Teams may have too many dashboards but not enough clarity on which metrics matter. IT and operations may define success differently. Users may receive software training without learning how analytics fits into their actual workflows. In other cases, the organization may lack enough analytics talent to translate raw data into useful guidance.
The result is a familiar gap: analytics exists, but decisions still happen through spreadsheets, email threads, manual updates, and reactive meetings.
How to Increase Analytics Adoption

- Start with the decision, not the tool. Identify the specific business decision analytics should improve, such as inventory positioning, supplier risk response, or transportation planning.
- Define the business outcome. Clarify whether the goal is better forecast accuracy, faster decisions, lower cost, stronger service levels, or improved resilience.
- Build role-specific dashboards. Give each team the metrics and alerts most relevant to its responsibilities.
- Pair data specialists with supply chain practitioners. Combine analytical skill with real-world operating knowledge.
- Train users on workflows. Focus training on how to interpret insights, respond to alerts, and make decisions.
- Assign owners for action. Make it clear who reviews insights, who follows up, and how decisions are escalated.
- Measure adoption and outcomes. Track platform usage, decision speed, forecast accuracy, supplier performance, service levels, and operational impact.
How Companies Can Overcome Supply Chain Analytics Challenges
Companies can overcome supply chain analytics challenges by improving data quality, integrating core systems, focusing analytics on specific decisions, assigning ownership, and embedding insights into daily workflows. The goal is not to collect more data for its own sake. The goal is to make better decisions with the data that matters most.
Define the Decision
Analytics should start with the decision the business needs to improve. That may include inventory positioning, supplier selection, logistics routing, demand planning, replenishment, or risk response.
Best Practice: Begin every analytics initiative by identifying the specific decision, owner, and business outcome it should support.
Map the Data
Once the decision is clear, teams need to identify which systems, functions, suppliers, and partners hold the required information. This often reveals gaps between ERP, WMS, TMS, procurement, planning, supplier, and external market data.
Best Practice: Build a simple data map that shows where critical information lives, how it flows, and where visibility breaks down.
Fix the Foundation
Analytics is only as reliable as the data behind it. Teams should clean, standardize, and govern the data fields that affect forecasts, supplier performance, inventory levels, lead times, order status, transportation performance, and cost.
Best Practice: Prioritize the data fields that directly influence planning, sourcing, logistics, and customer delivery decisions.
Connect the Workflow
Insights are more likely to be used when they appear inside the processes teams already use to plan, source, move, and deliver goods. Analytics should support daily workflows across planning, procurement, logistics, supplier management, and operations.
Best Practice: Embed analytics into existing workflows so teams can act on insights without leaving the systems and processes they use every day.
Assign Action Owners
Even accurate analytics can stall if no one is responsible for acting on the insight. Teams need clear ownership for reviewing alerts, making decisions, escalating issues, and following through.
Best Practice: Assign owners for key insights, alerts, and decisions before launching the dashboard or analytics workflow.
Measure Outcomes
Analytics should be measured by business impact, not only by tool usage. Relevant outcomes may include decision speed, forecast accuracy, service levels, supplier performance, inventory turns, cost reduction, and risk response.
Best Practice: Track whether analytics improves the decisions it was designed to support, then refine the process based on results.
What Tools Are Used in Supply Chain Analytics?
Supply chain analytics tools include ERP systems, planning platforms, warehouse and transportation systems, procurement analytics, supplier management platforms, business intelligence dashboards, control towers, predictive modeling tools, digital twins, AI-enabled analytics platforms, and market intelligence platforms. Each tool category supports a different part of the data-to-decision process.
- ERP systems: Centralize core business data related to orders, inventory, finance, purchasing, production, and supplier activity.
- WMS platforms: Track warehouse inventory, fulfillment activity, labor utilization, picking accuracy, and storage performance.
- TMS platforms: Provide transportation data related to carrier performance, routing, freight cost, shipment status, and delivery timing.
- Procurement analytics tools: Analyze spend, supplier performance, contract compliance, sourcing activity, and category-level trends.
- Supplier management platforms: Help teams monitor supplier risk, performance, quality, documentation, and relationship data.
- Supply chain planning systems: Support demand planning, supply planning, replenishment, capacity planning, and scenario analysis.
- Business intelligence dashboards: Turn data from multiple systems into visual reports, KPIs, alerts, and performance summaries.
- Control towers: Provide a centralized view of supply chain activity, exceptions, risk signals, and operational status.
- Predictive modeling tools: Use statistical models and machine learning to forecast demand, lead times, disruptions, and capacity constraints.
- Digital twins: Create virtual models of supply chain networks so teams can test scenarios before making operational changes.
- AI and machine learning tools: Detect patterns, identify anomalies, generate recommendations, and support faster decision-making.
- Market intelligence platforms: Add external context around commodities, suppliers, components, logistics conditions, and global market trends.
These tools are enablers, not complete solutions. They only create value when supported by clean data, integrated workflows, governance, and adoption.
FAQs on Supply Chain Analytics Challenges
What is the difference between supply chain visibility and supply chain analytics?
Supply chain visibility shows what is happening across suppliers, inventory, logistics, and operations. Supply chain analytics uses that visibility to identify patterns, evaluate tradeoffs, forecast outcomes, and guide better decisions.
How should companies prioritize supply chain analytics use cases?
Companies should prioritize use cases based on business impact, data availability, decision urgency, and operational feasibility. High-value starting points often include demand forecasting, inventory optimization, supplier performance, logistics visibility, and risk monitoring.
What metrics should companies use to measure supply chain analytics success?
Useful metrics include forecast accuracy, decision speed, inventory turns, service levels, supplier on-time delivery, transportation cost, expedited freight usage, stockout rates, and risk response time. The right metrics should connect analytics activity to measurable business outcomes.
How does supply chain analytics support risk management?
Supply chain analytics supports risk management by helping teams identify early warning signals, monitor supplier and logistics performance, model disruption scenarios, and compare response options. This gives organizations more time to act before small issues become larger operational problems.
When should companies use predictive or prescriptive analytics?
Companies should use predictive analytics when they need to understand what is likely to happen, such as demand changes, supplier delays, or inventory shortages. Prescriptive analytics is more useful when teams need recommended actions, such as adjusting inventory, rerouting shipments, changing suppliers, or reallocating capacity.
How can companies balance automation with human judgment?
Companies can balance automation with human judgment by using analytics to surface risks, patterns, and recommendations while keeping people responsible for context, tradeoffs, and final decisions. This is especially important when decisions affect customers, suppliers, cost, compliance, or business continuity.
What role does market intelligence play in supply chain analytics?
Market intelligence adds external context to internal supply chain data. It helps teams understand commodity trends, supplier conditions, component availability, logistics disruptions, and regional market changes that may not appear in internal systems until later.
How Jabil Helps Turn Supply Chain Analytics Into Action
Complexity in procurement and supply chain isn’t slowing down, and execution is what separates strong analytics strategies from real results. Jabil Procurement & Supply Chain Services helps organizations operationalize change through procurement and supply chain consulting, managed services, logistics management, and market intelligence, so teams can turn supply chain data into better decisions in a way that’s repeatable, not reactive.
Jabil is a practitioner-led operating partner built to manage high-variability, high-stakes global supply chains, helping teams move from fragmented visibility and disconnected insights to durable execution with confidence and consistency.
With 60+ years of supply chain expertise, $25B+ in annual procurement spend, 38,000+ supplier relationships, 3,000+ supply chain experts, and a global footprint spanning 100+ locations across 25+ countries, Jabil brings the scale and execution depth required to make supply chain analytics improvements stick.